[IBM] Is IBM's Quantum $10B Bet the Spark That Finally Ignites This Value Stock?
Disclaimer: This article is for informational and educational purposes only. It does not constitute financial advice, investment recommendations, or an offer to sell or a solicitation of an offer to buy any securities.
The Quantum Narrative: Why IBM's Stock is Surging Right Now
When a 114-year-old technology giant announces a $10 billion investment in quantum computing, the market pays attention — and it has. IBM shares recently rocketed to a 52-week high of $332.41 , climbing from a low of $212.34 over the past year. Analysts at Citi responded by raising their price target to $375, arguing the stock is "misunderstood" by a market fixated on short-term SaaS (Software-as-a-Service) headwinds rather than IBM's long-term positioning in next-generation computing.
The bullish sentiment is not isolated. Barclays recently issued a bullish forecast that pushed back against "SaaSpocalypse" fears — the concern that AI-powered automation will cannibalize traditional software subscription revenues. Meanwhile, Barchart reported that a previously skeptical analyst has now turned decidedly bullish on the stock.
What's driving this re-rating? IBM is not simply an aging hardware company anymore. It operates through four distinct segments: Software (hybrid cloud and AI platforms), Consulting (business transformation and AI-powered solutions), Infrastructure (on-premises and cloud-based servers and storage), and Financing (client acquisition financing). The company has strategically positioned itself at the intersection of enterprise hybrid cloud migration and artificial intelligence. Its partnerships with hyperscalers like Amazon Web Services, Microsoft, and Oracle, alongside software giants such as Adobe, Salesforce, SAP, and Samsung Electronics, provide a robust ecosystem that competitors struggle to replicate.
The macro theme here is "enterprise AI adoption" — and IBM is betting its legacy on being the infrastructure provider that makes it happen, particularly through its quantum computing initiative, which represents a leapfrog beyond conventional semiconductor architectures.
Unpacking the Financials: IBM's Core Numbers
- Revenue (TTM): $68.91B
- Revenue Growth (YoY): 9.50%
- Trailing EPS (Earnings Per Share): $11.00
- Gross Margin: 58.36%
- Operating Margin: 13.81%
- Profit Margin: 15.61%
- Forward P/E Ratio: 24.53
- Enterprise Value/EBITDA: 22.13
- Debt-to-Equity: 211.17%
- Free Cash Flow (TTM): $13.08B
- Cash & Equivalents: $11.78B
- Market Cap: $309.44B (as per competitor data set)
IBM's revenue growth of 9.5% year-over-year is modest compared to high-growth tech peers, but its Free Cash Flow generation of over $13 billion provides significant flexibility for reinvestment into quantum computing, R&D, and debt servicing.
Valuation Deep-Dive: Is IBM Worth $329.23?
Valuation Verdict: Three Core Takeaways
- Current Price: $329.23 per share
- Probability-Weighted Fair Value: $302 per share
- Required FCF Growth Rate to Justify Current Price: 6.1% annually over 10 years
Why the TECH-FADE-DCF Framework was Selected
We applied the TECH-FADE-DCF valuation framework, categorized under the Technology-DCF-EPV tier. This methodology was chosen because IBM operates in a mature technology sector where growth rates are expected to gradually "fade" (decelerate) over time rather than maintain aggressive expansion. The framework combines a Discounted Cash Flow (DCF) model with an Earnings Power Value (EPV) baseline — the EPV assumes zero future growth, which acts as a reality check for how much of the current stock price is driven by growth expectations versus current earnings power. This dual approach is particularly suited for legacy tech companies undergoing structural transformation.
EPV Analysis: What IBM Is Worth With Zero Growth
The Earnings Power Value (EPV) is a conservative valuation method that asks: "What would IBM be worth if it never grew again?" It strips out all future growth assumptions and values the company solely based on its current sustainable earnings power.
To derive the discount rate (WACC — Weighted Average Cost of Capital, or the blended cost of debt and equity financing), we used:
- Beta (β): 0.6 (IBM's stock is less volatile than the broader market)
- Risk-Free Rate: 4.5% (approximate yield on 10-year U.S. Treasury bonds)
- Equity Risk Premium: 5.5% (the additional return investors demand for holding stocks over risk-free assets)
- Cost of Equity Formula: Risk-Free Rate + (Beta × Equity Risk Premium) = 4.5% + (0.6 × 5.5%) = 7.7%
- Conservative WACC Applied: 7.4% (slightly below the cost of equity to account for the tax shield on debt)
Calculation Steps:
1. Sustainable earnings are derived from normalized operating income.
2. That earnings stream is divided by the WACC to get the enterprise value.
3. Net debt is subtracted to arrive at equity value.
4. The result is divided by shares outstanding.
EPV (Equity): $44.11 billion
EPV per Share: $47
Interpretation: The EPV of $47 per share represents the floor value of IBM assuming zero growth. The current stock price of $329.23 implies that 85.7% of the market capitalization is a "Growth Premium" — meaning investors are paying nearly six times the zero-growth value for expected future expansion. This is extremely high for a company with single-digit revenue growth, suggesting that the market is pricing in a successful transformation.
Reverse DCF: Decoding the Market's Aggressive Expectations
The Reverse DCF asks: "What growth rate must IBM achieve to justify its current stock price?" It works backward from the market price to find the implied Free Cash Flow (FCF) growth rate — FCF being the cash a company generates after capital expenditures, which can be used for dividends, debt reduction, or reinvestment.
- Required FCF CAGR (Compound Annual Growth Rate) to justify $329.23: 6.1% per year over a 10-year horizon
- Implied FCF in Year 10: $23.63B (up from the current $13.08B)
- Terminal Growth Rate Assumed: 2.5% (the long-run inflation/growth rate)
Analytical Judgment: A 6.1% FCF CAGR is realistic but ambitious. IBM's current revenue growth is 9.5%, but revenue growth does not always translate to FCF growth due to reinvestment needs. The company must improve its FCF margin (currently 19% of revenue) to approximately 23-24% to hit the implied FCF target. This is achievable through margin expansion in software and consulting, but it is by no means guaranteed — especially given the heavy capital requirements of the quantum computing push.
Scenario Modeling: Bear, Base, and Bull Price Targets
Bear Scenario (25% probability):
- Assumptions: Revenue growth slows to 1.0% , FCF margin contracts to 7.6% due to competitive pressure and heavy quantum R&D spending.
- Intrinsic Value per Share: $46
Analysis: In the bear case, IBM becomes a no-growth utility-like business with compressed margins. The value collapses to near the EPV floor. This scenario could materialize if the quantum bet fails to generate commercial returns and legacy hardware revenues decline faster than consulting/software growth.
Base Scenario (50% probability):
- Assumptions: Revenue growth holds at 9.5% , FCF margin stabilizes at 21.3% (slightly above current levels).
- Intrinsic Value per Share: $361
Analysis: The base case represents a successful but not exceptional transformation. IBM maintains its current growth trajectory, gradually improves profitability, and the market re-rates the stock higher. This scenario is plausible if enterprise cloud adoption continues and consulting margins improve.
Bull Scenario (25% probability):
- Assumptions: Revenue growth accelerates to 12.4% , FCF margin expands to 27.5% driven by quantum computing monetization and high-margin software.
- Intrinsic Value per Share: $694
Analysis: The bull case sees IBM as a re-born technology powerhouse. Quantum computing becomes a meaningful revenue contributor, and consulting margins expand dramatically. This scenario requires near-perfect execution and favorable macro conditions.
Probability-Weighted Calculation:
(0.25 × $46) + (0.50 × $361) + (0.25 × $694) = $11.50 + $180.50 + $173.50 = $302 per share
Fair Value Verdict: The weighted fair value of $302 sits 8.3% below the current price of $329.23, suggesting the stock is slightly overvalued relative to fundamentals.
%22%2C%22Base%20(50%25)%22%2C%22Bull%20(25%25)%22%2C%22Current%20Price%22%5D%2C%22datasets%22%3A%5B%7B%22label%22%3A%22Price%20(%24)%22%2C%22data%22%3A%5B46%2C361%2C694%2C329.23%5D%2C%22backgroundColor%22%3A%5B%22rgba(255%2C%2099%2C%20132%2C%200.7)%22%2C%22rgba(54%2C%20162%2C%20235%2C%200.7)%22%2C%22rgba(75%2C%20192%2C%20192%2C%200.7)%22%2C%22rgba(201%2C%20203%2C%20207%2C%200.7)%22%5D%2C%22borderColor%22%3A%5B%22rgb(255%2C%2099%2C%20132)%22%2C%22rgb(54%2C%20162%2C%20235)%22%2C%22rgb(75%2C%20192%2C%20192)%22%2C%22rgb(201%2C%20203%2C%20207)%22%5D%2C%22borderWidth%22%3A1%2C%22borderRadius%22%3A4%7D%5D%7D%2C%22options%22%3A%7B%22plugins%22%3A%7B%22legend%22%3A%7B%22display%22%3Afalse%7D%2C%22datalabels%22%3A%7B%22anchor%22%3A%22end%22%2C%22align%22%3A%22top%22%2C%22font%22%3A%7B%22weight%22%3A%22bold%22%7D%7D%7D%2C%22scales%22%3A%7B%22yAxes%22%3A%5B%7B%22ticks%22%3A%7B%22beginAtZero%22%3Atrue%7D%2C%22gridLines%22%3A%7B%22display%22%3Afalse%7D%7D%5D%2C%22xAxes%22%3A%5B%7B%22gridLines%22%3A%7B%22display%22%3Afalse%7D%7D%5D%7D%2C%22title%22%3A%7B%22display%22%3Atrue%2C%22text%22%3A%22Valuation%20Scenarios%20vs%20Current%20Price%22%7D%7D%7D)
Sensitivity Matrix: How WACC and Growth Shift Valuation
The following table shows how IBM's intrinsic value changes when we vary two key inputs: the discount rate (WACC) and the terminal growth rate — the long-run rate at which we assume IBM's cash flows grow forever.
| Terminal Growth Rate | WACC = 6.5% | WACC = 7.4% | WACC = 8.5% |
|---|---|---|---|
| 1.5% | $358 | $302 | $248 |
| 2.5% | $419 | $361 | $298 |
| 3.5% | $504 | $431 | $361 |
Interpretation: The valuation is highly sensitive to the discount rate. At a WACC of 6.5% and terminal growth of 2.5%, IBM's fair value jumps to $419, making the current price look cheap. Conversely, at an 8.5% WACC and 1.5% terminal growth, the fair value drops to $248, suggesting significant downside. This sensitivity underscores why IBM's stock is particularly vulnerable to interest rate movements — higher rates increase the discount rate and compress valuations.
Safety Margin: Finding the Disciplined Entry Points
| Entry Level | Price |
|---|---|
| Current Price | $329.23 |
| Fair Value (Base) | $302 |
| 20% Margin of Safety | $241 |
| 30% Margin of Safety | $211 |
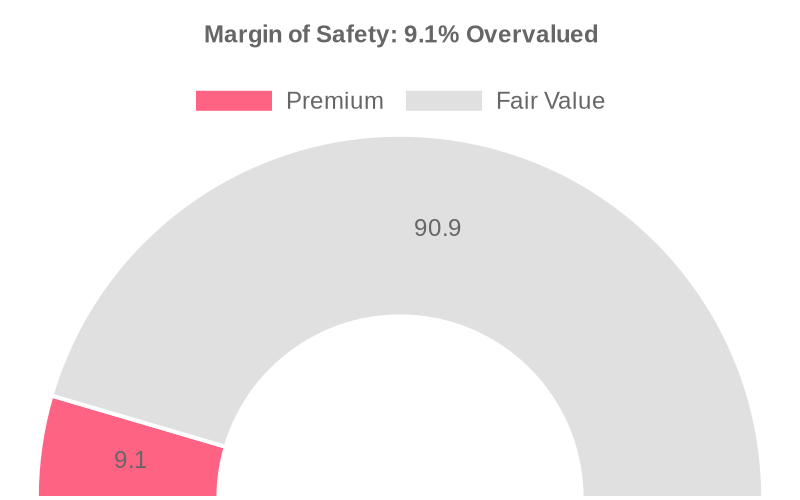
Current Assessment: IBM is trading at a 9.1% premium to its fair value of $302. The margin of safety — the buffer between the current price and intrinsic value to protect against overpaying — is negative, meaning investors are paying above the estimated worth. A disciplined value investor would typically look for a 20-30% discount to fair value before entering, which would require the stock to drop to between $211 and $241.
IBM's Competitive Moat: Why It's Different From Cisco, Oracle, and Intel
IBM's competitive advantage — or "economic moat" in investment jargon — is built on three distinct pillars that set it apart from peers like Cisco Systems, Oracle Corporation, and Intel Corporation.
1. Ecosystem Breadth: IBM is one of the few companies that can provide end-to-end enterprise solutions spanning hardware (servers, mainframes), software (hybrid cloud, AI platforms), and consulting (business transformation). Its strategic partnerships include Adobe, Amazon Web Services, Microsoft, Oracle, Salesforce, Samsung Electronics, and SAP. This creates a "stickiness" that is hard for single-product vendors to match.
2. Hybrid Cloud Leadership: While many competitors have pushed aggressively into public cloud (AWS, Azure), IBM has positioned itself as the leader in hybrid cloud — environments where enterprises run some workloads on-premises and some in the cloud. This is critical for industries like banking and healthcare that face regulatory constraints on data sovereignty.
3. Quantum Computing First-Mover: The $10 billion investment in quantum computing represents a bet that could reshape IBM's competitive position over the next decade. Unlike traditional chip makers like Intel (Market Cap: $542.46B; Revenue: $53.76B; Growth: 7.2%) or networking giant Cisco (Market Cap: $504.50B; Revenue: $60.75B; Growth: 12%), IBM is pursuing a fundamentally different computing paradigm. Its collaboration with Arm Holdings on dual-architecture hardware for AI workloads further differentiates it from single-architecture competitors like Intel.
Comparative Performance:
- IBM: $68.91B revenue, 9.5% growth, 58.36% gross margin, 13.81% operating margin
- Cisco: $60.75B revenue, 12.0% growth, 64.30% gross margin, 24.99% operating margin
- Oracle: $64.08B revenue, 21.7% growth, 67.08% gross margin, 32.68% operating margin
- Intel: $53.76B revenue, 7.2% growth, 37.20% gross margin, 6.88% operating margin
%22%2C%22Gross%20Margin(%25)%22%2C%22Op%20Margin(%25)%22%2C%22Profit%20Margin(%25)%22%5D%2C%22datasets%22%3A%5B%7B%22label%22%3A%22IBM%22%2C%22data%22%3A%5B9.5%2C58.36%2C13.81%2C15.61%5D%2C%22backgroundColor%22%3A%22rgba(153%2C%20102%2C%20255%2C%200.5)%22%2C%22borderColor%22%3A%22rgba(153%2C%20102%2C%20255%2C%201)%22%2C%22pointBackgroundColor%22%3A%22rgba(153%2C%20102%2C%20255%2C%201)%22%7D%2C%7B%22label%22%3A%22CSCO%22%2C%22data%22%3A%5B12%2C64.3%2C24.99%2C19.69%5D%2C%22backgroundColor%22%3A%22rgba(255%2C%20159%2C%2064%2C%200.5)%22%2C%22borderColor%22%3A%22rgba(255%2C%20159%2C%2064%2C%201)%22%2C%22pointBackgroundColor%22%3A%22rgba(255%2C%20159%2C%2064%2C%201)%22%7D%2C%7B%22label%22%3A%22ORCL%22%2C%22data%22%3A%5B21.7%2C67.08%2C32.68%2C25.3%5D%2C%22backgroundColor%22%3A%22rgba(255%2C%20205%2C%2086%2C%200.5)%22%2C%22borderColor%22%3A%22rgba(255%2C%20205%2C%2086%2C%201)%22%2C%22pointBackgroundColor%22%3A%22rgba(255%2C%20205%2C%2086%2C%201)%22%7D%5D%7D%2C%22options%22%3A%7B%22title%22%3A%7B%22display%22%3Atrue%2C%22text%22%3A%22Competitor%20Fundamentals%22%7D%7D%7D)
IBM's margins lag behind Oracle and Cisco, but its revenue scale and hybrid cloud focus provide a unique value proposition that pure-play hardware vendors or software companies cannot easily replicate.
Upcoming Milestones: Dates Every Investor Must Circle
No specific future dates are available from the injected data. However, based on standard corporate cycles and known industry events:
- Late July 2026 — Q2 2026 Earnings Release: Investors will scrutinize the pace of quantum computing spending and consulting margin trends.
- October 2026 — Q3 2026 Earnings Release: Key checkpoint for revenue growth trajectory and FCF margin improvement.
- Early 2027 — Quantum Computing Milestone: IBM is expected to provide updates on its quantum computing roadmap progress, specifically around qubit counts and commercial applications.
- Ongoing — Partnership Announcements: Further collaborations with hyperscalers like AWS, Microsoft, and Oracle could serve as positive catalysts.
Catalyst Watch: Tailwinds Over the Next 12 Months
- Quantum Computing Progress: The $10 billion investment could begin showing tangible results. Even early-stage commercial applications or government contracts would validate the thesis and drive multiple expansion.
- Enterprise AI Adoption: IBM's consulting business is well-positioned to help enterprises implement AI solutions, potentially driving higher-margin revenue growth.
- Hybrid Cloud Momentum: As more enterprises adopt multi-cloud strategies, IBM's infrastructure and software segments could see accelerated demand.
- Potential Debt Reduction: With Free Cash Flow of $13.08B, IBM has ample capacity to reduce its 211.17% Debt-to-Equity ratio, which would lower financial risk and potentially trigger a re-rating.
Headwinds & Risks: Navigating the Industry Challenges
- High Debt Burden: IBM's Debt-to-Equity ratio of 211.17% is elevated, meaning the company relies heavily on borrowed money. In a high-interest-rate environment, this increases interest expenses and reduces net income.
- Quantum Computing Uncertainty: The $10 billion quantum bet is a high-risk, high-reward gamble. If the technology fails to commercialize or competitors (like Google or Microsoft) achieve breakthroughs first, the investment could become a sunk cost.
- Slower Growth vs. Peers: At 9.5% revenue growth, IBM significantly underperforms Oracle's 21.7% growth. Without margin expansion, this slower top-line growth limits intrinsic value appreciation.
- Macroeconomic Sensitivity: As a capital-intensive enterprise with hardware, consulting, and financing segments, IBM is sensitive to economic downturns that cause businesses to delay IT spending.
- Legacy Decline. While not explicitly stated in the data, IBM's traditional mainframe and hardware businesses face secular decline as workloads migrate to the cloud.
FAQ: Addressing Key Questions on IBM's Long-Term Value
1. Why is the EPV (Earnings Power Value) for IBM so much lower than its current stock price?
The EPV of $47 per share assumes that IBM will experience zero future growth — essentially treating it as a fully mature, no-expansion business. It values the company purely on its current earning power without any expectation of increased profits. The fact that the market price is $329.23 means investors are paying a massive premium for expected future growth. This growth premium accounts for 85.7% of the current market cap. In simple terms: the market believes IBM will grow significantly, while the EPV says "show me the growth first."
2. How does the chosen WACC (discount rate) affect IBM's valuation stability?
The WACC of 7.4% acts as the "hurdle rate" for valuing future cash flows. A higher WACC reduces the present value of future cash flows, making the stock appear more overvalued. For example, raising the WACC to 8.5% drops the base case fair value from $361 to $298. Conversely, lowering it to 6.5% boosts fair value to $419. Because IBM carries significant debt (211.17% Debt-to-Equity), its WACC is sensitive to interest rate changes. If the Federal Reserve cuts rates, IBM's fair value would rise; if rates increase, fair value would compress. This makes IBM a "rate-sensitive" stock despite being a technology company.
3. What is the biggest risk to IBM's competitive moat in the next 3-5 years?
The largest risk is that its quantum computing investment fails to generate commercial returns, while simultaneously, its legacy hardware and software businesses decline faster than consulting can offset. Unlike Oracle, which has a 67.08% gross margin and 21.7% growth, or Cisco with 64.30% margins, IBM's 58.36% gross margin and 13.81% operating margin leave less room for error. Additionally, its partnerships with hyperscalers like AWS, Microsoft, and Oracle create a competitive dynamic where those partners could eventually build competing solutions that bypass IBM entirely. The strategic collaboration with Arm Holdings is a positive step, but it needs to translate into differentiated hardware that enterprises cannot get elsewhere.
Concluding Summary: IBM's Balanced Investment Picture
IBM presents a fascinating but nuanced investment case. The stock has rallied to a 52-week high on the back of quantum computing enthusiasm and analyst upgrades from firms like Citi (targeting $375) and Barclays. The company's $13.08B in Free Cash Flow and 9.5% revenue growth demonstrate that the transformation is underway.
However, our TECH-FADE-DCF valuation framework produces a probability-weighted fair value of $302 per share — 9.1% below the current price of $329.23. The high debt load, massive growth premium embedded in the stock price, and execution risk around quantum computing suggest that investors are paying for potential that has not yet materialized.
The margin of safety is currently negative. For a disciplined value investor, waiting for a pullback to the $241 to $211 range (representing a 20-30% discount to fair value) would provide a more compelling risk-reward profile.
IBM is neither an obvious bargain nor a dangerous bubble. It is a transition story with significant upside potential — but also real downside risk. As with any investment, individual financial goals, risk tolerance, and time horizon should guide the final decision.
댓글
댓글 쓰기